Product updates
PI2 upgrade support guide
Preparing for your upgrade
Taking action after your upgrade
Product updates
Diagnose
We’ve redesigned Diagnose to be easier to use, while introducing new types of surveys to allow you to monitor engagement trends faster and more closely.
Note: All your Legacy PI survey data will be available to view in PI2 via PDF download. (These records are available for historical reference, but are view-only and cannot be leveraged by PI2’s survey analysis tools.) Feel free to download a backup of your data prior to your upgrade date, but it’s not necessary to do so.
Biggest changes in PI2
Pulse surveys: Get faster, more focused feedback
The legacy Diagnose experience let you dig deep into the causes of engagement with our Employee Experience (“XP”) Survey. The XP is back in PI2, of course—but what if you want to monitor engagement more frequently than just once or twice a year?
We’re pleased to share that we’ve added pulse surveys to Diagnose in PI2. Log in, and you’ll see five pulse surveys that can be completed in 5 minutes or less, plus an “Overall Pulse Check” survey that takes 10 minutes. These surveys—which range in topic from job satisfaction to team trust—let you get focused feedback in a particular area of the employee experience.
Use these pulse surveys in combination with the XP to follow up on critical areas of disengagement or track improvements over time.
New analytics tools: Trends, heatmap data, and more
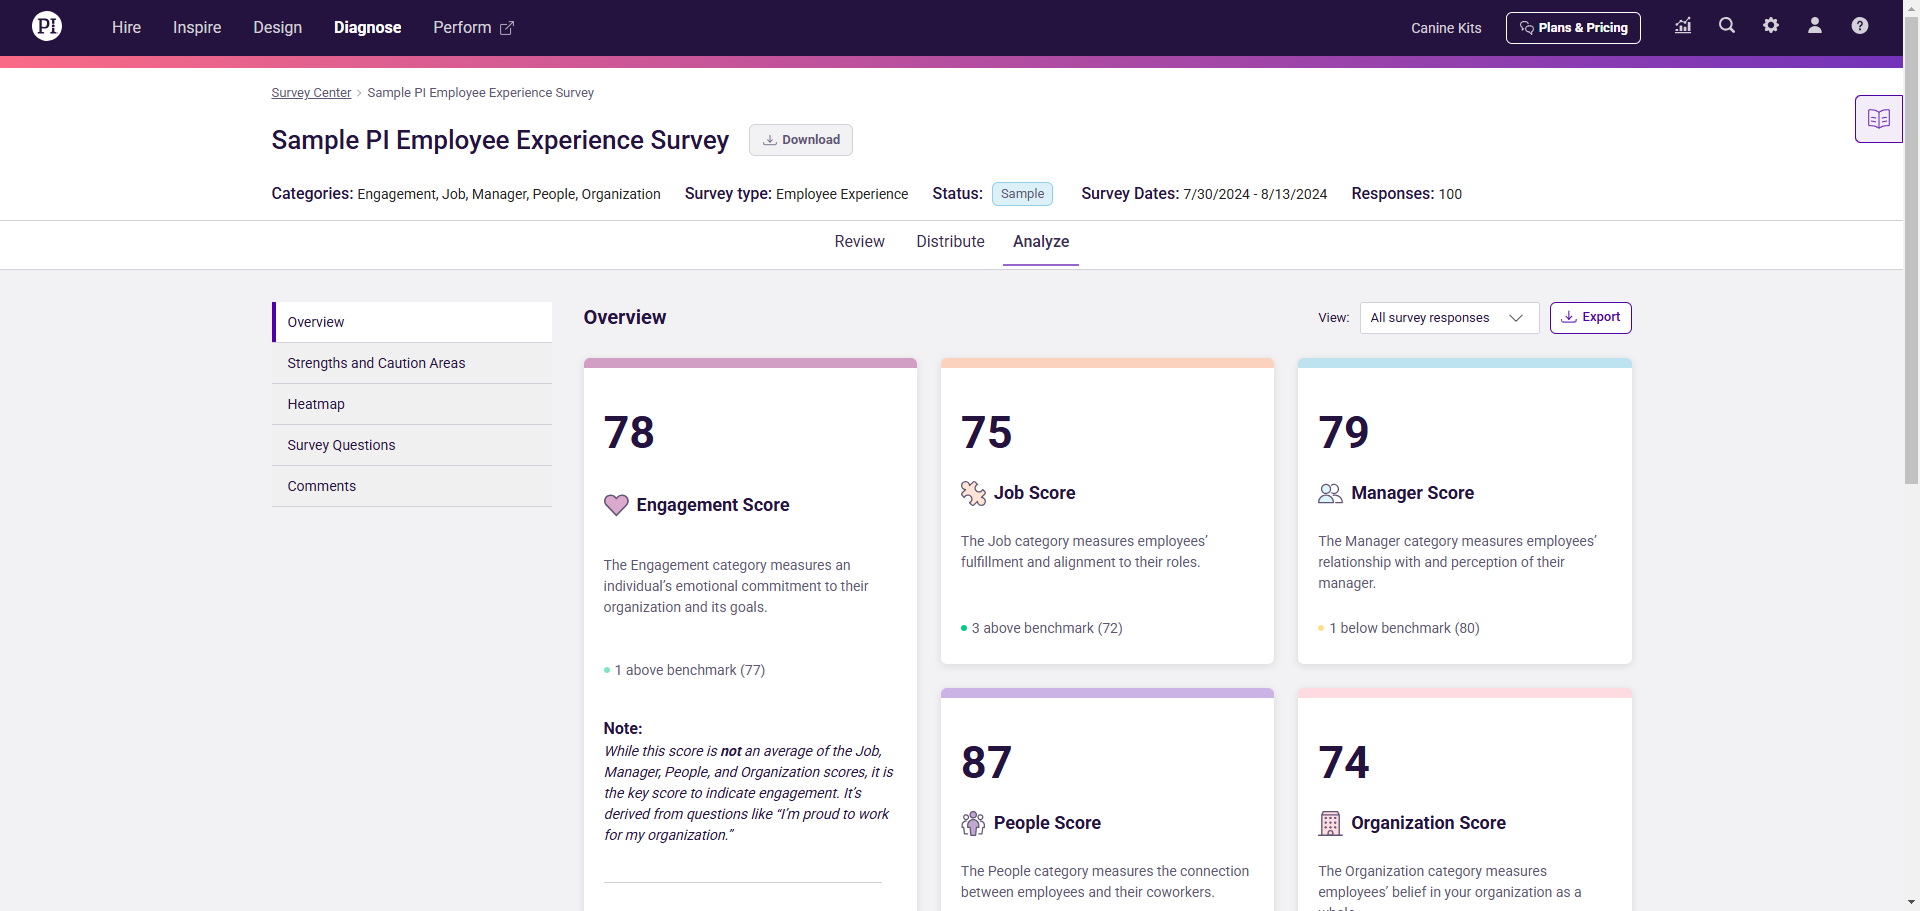
With PI2, we wanted to give you even more ways to interact with survey data and uncover engagement trends. Click on the “Analyze” tab when viewing a survey, and you’ll see several new analytics tools available to you:
Use the Overview page to view high-level trends. New to PI2, you can now monitor survey data over time (quarterly, YoY, etc.). See how your team or organization is performing across five scores—Engagement, Job, Manager, People, and Organization—and pinpoint where you’re improving fastest or slowest.
Use the Heatmap page to view survey data at the team level for teams with five or more responses. See where engagement is strongest or weakest at a glance, so you can prioritize your action plan accordingly.
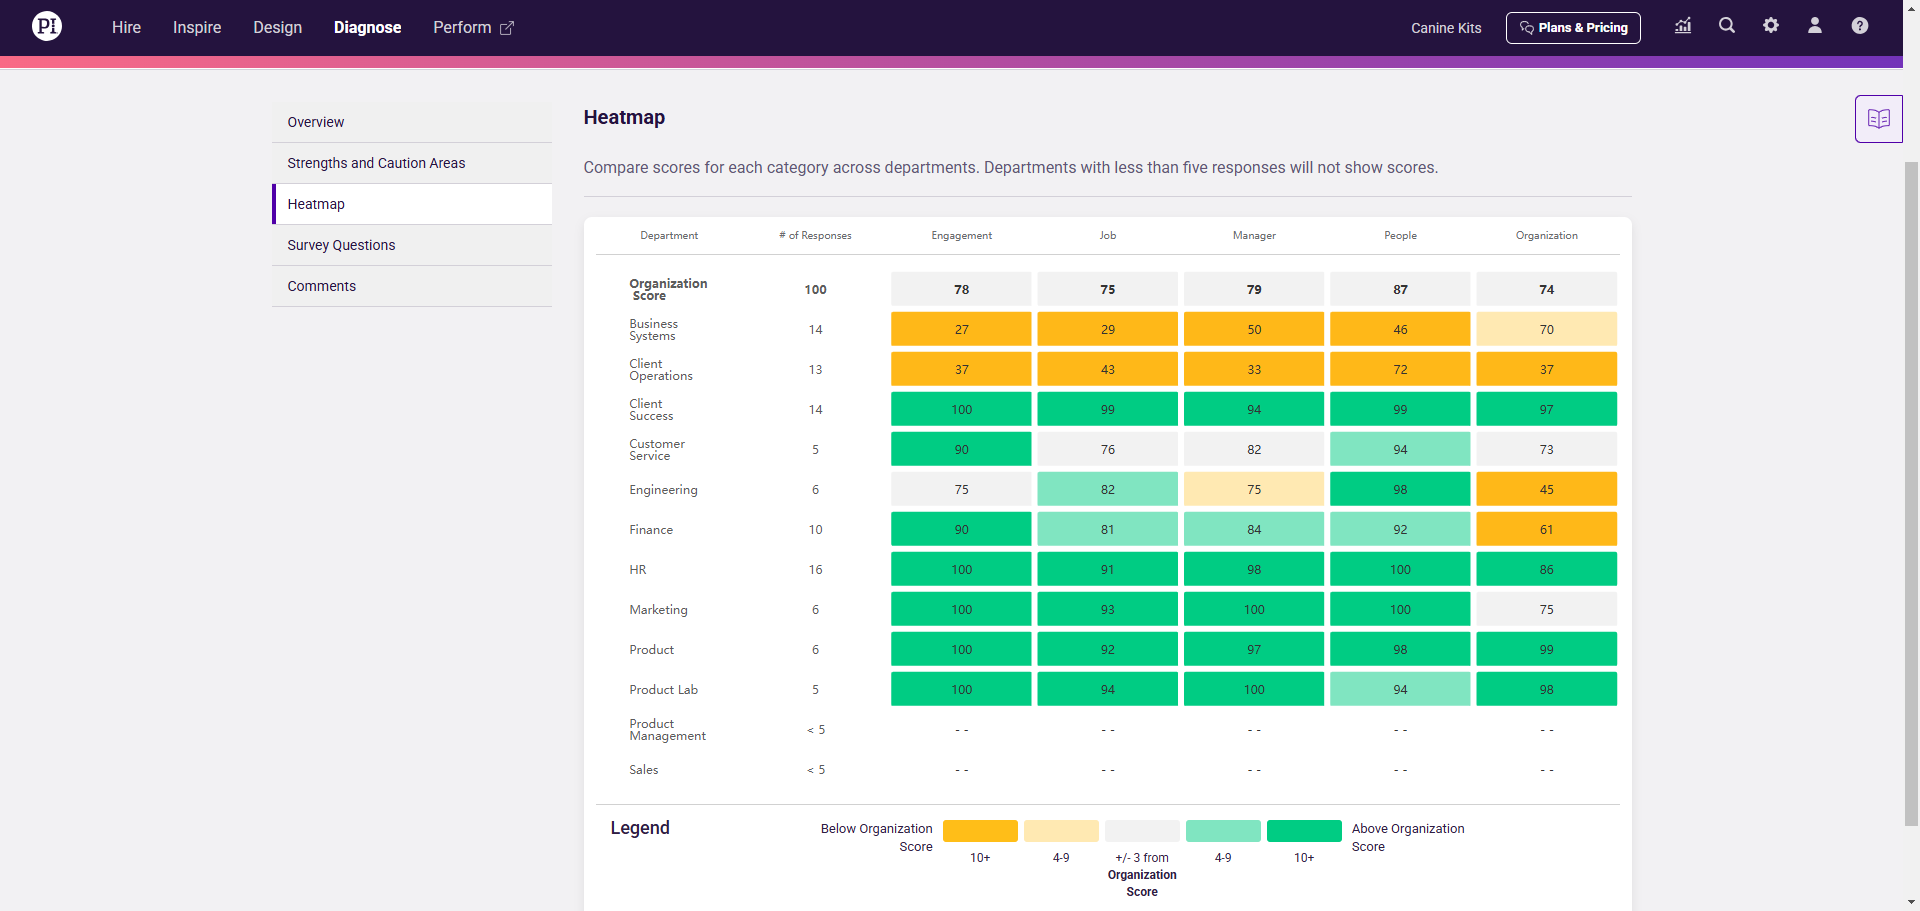
As with the legacy experience, you can also explore results for specific survey questions, or view your biggest strengths and caution areas.
We also plan to roll out additional analytics tools—such as advanced filtering—later this year.
Survey filters: Drill into specific engagement trends
New to PI2, we’ve also added survey filters to Diagnose. Slice and dice data by a variety of fields—including Department, Location, and Tenure—to see how engagement is trending up or down for different groups in your organization.
We’ve also added the ability to create your own custom fields. If you have a way of organizing employee data that isn’t covered out-of-the-box in Diagnose, feel free to add that field yourself.
FAQs
Our pulse surveys were developed by our Science team, and have been tested and validated for their ability to measure employee engagement.
“We developed our pulse surveys to target specific aspects of the employee experience (job, manager, etc.) so that organizations can understand what specifically they can change to increase employee engagement,” said Dana Pollet, PhD, Manager of Product Science at PI. “We brainstormed the entire nomological network of what would fall under each category and then had our internal teams vote on which topics we felt would be most impactful and relevant for businesses and employees today.
“Once we decided on which topics to measure, our Science, Product, and Content teams collaborated to write questions that would accurately reflect each construct. We established a pool of over 200 items measuring these constructs, then refined, tested, and analyzed these items to determine which had the strongest item statistics and which were the most strongly linked to engagement. This research also allowed us to establish benchmarks that are based on a sample of 1,000 working adults in the U.S.”
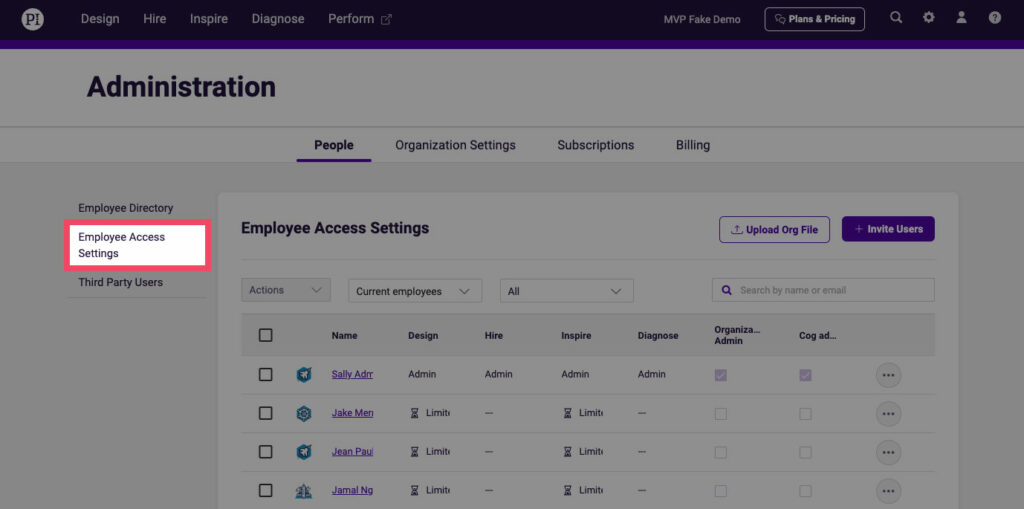
Diagnose admins and organization admins have unrestricted access to all Diagnose features. They can create surveys, edit all existing surveys, and view all survey results. Learn about Diagnose access levels.
Diagnose admins, organization admins, and full users are permitted to view all survey results. Limited users, by contrast, are not permitted to view survey results.
To restrict someone’s ability to view survey results, set their access level to limited.