PI Basics
Build your PI foundation
Overview
The Predictive Index was founded over 70 years ago with an ambitious mission: Better Work, Better World. Our passion, inherited from our founder Arnold Daniels, is to understand people and teams—specifically what drives behaviors at work. Like you, we strive to understand that behavior and ignite enthusiasm in your people.
Our software hones the wisdom, guidance, and data that help inspire employees to be the most productive, engaged, and self-aware professionals they can be.
Patterns
The primary result of the PI Behavioral Assessment™️, and the engine behind many of the insights you see about a person, is a pattern. The pattern is made up of Factors, which shed light on the amount and intensity key behavioral drives to help predict and understand workplace behavior.
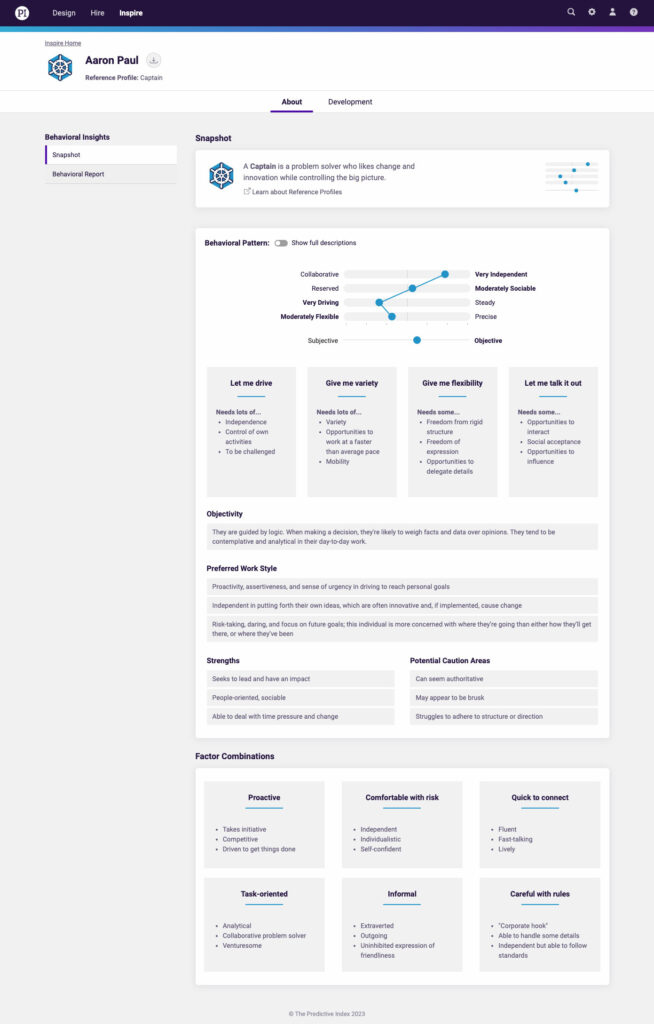
Snapshot
A Snapshot is created for anyone who completes the Behavioral Assessment™️ and can be found by clicking View more > from the Person page.
The snapshot provides a summary of the person’s results, including their Reference Profile, pattern, preferred work style, strengths, caution areas, and Factor Combinations.
Self and Self-Concept
The data and insights you see in our product primarily use what we call the Self Awareness pattern. That’s because it’s the most important! It describes your true self — your most natural workplace behaviors — the person that you described when you were taking the Behavioral Assessment and selected the words “that you yourself believe really describe you.”
But, there are times when you’ll see and use the information that includes an additional pattern, Self-Concept, which is created from the words you selected to describe “the way you are expected to act by others.”
Both the Self and Self-Concept patterns are a result of the same Behavioral Assessment.
In an ideal world, your internal drives and external demands would be perfectly aligned. But workplaces are rarely that simple, and people often feel expected to work in ways that run counter to their natural strengths.
Self-Concept shows how a person perceives the external demands of their work environment.
Seeing differences in Self and Self-Concept can give you insight into how someone is trying to balance their expected behavior versus what comes most natural to them. If the patterns are close, they may not need to spend a lot of energy meeting the expectations of the role. Where they differ can indicate where a person may be adapting to meet expectations.
Knowing this can potentially help facilitate conversations around important areas that align with Inspire, such as inclusion, development, and “stretching” one’s factors in productive/positive ways.
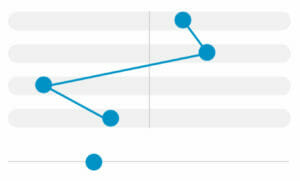
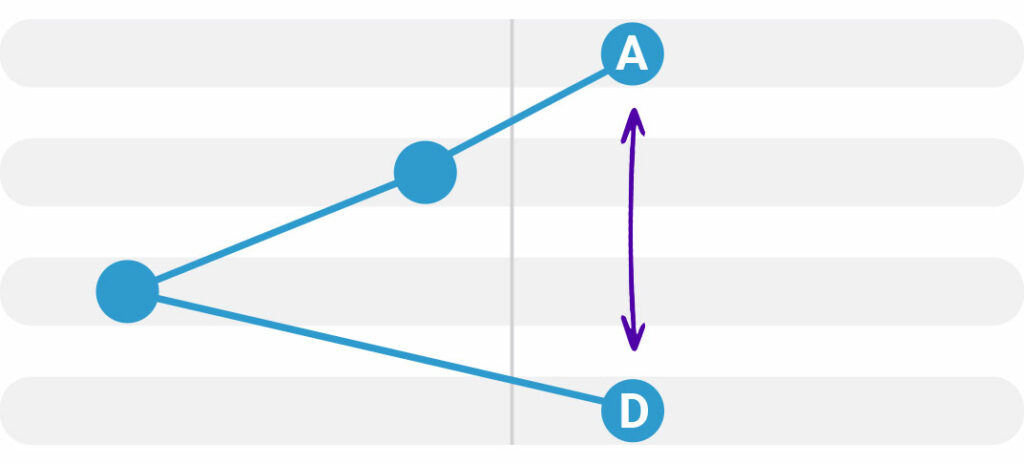
Let’s take a look at the example below.
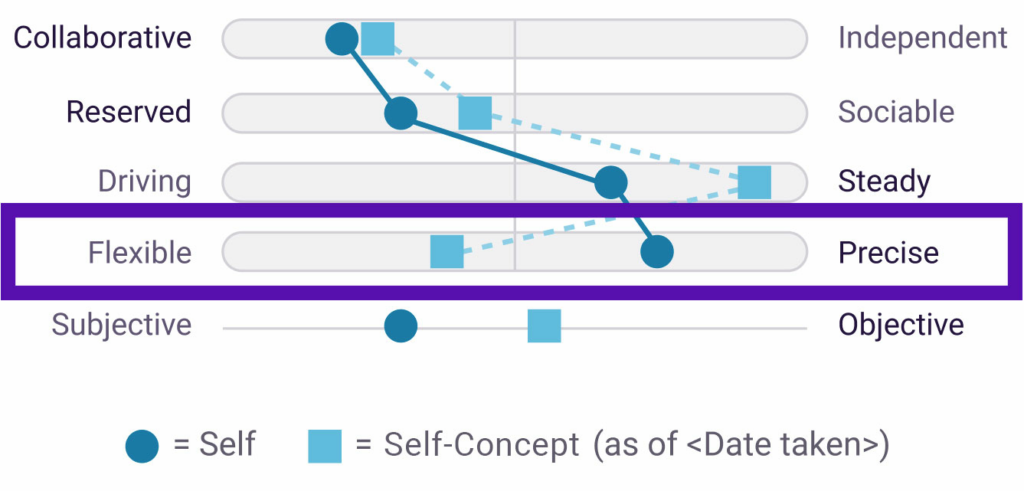
For the most part in the example above, the Self and Self-Concept are aligned. However, this person’s amount of Formality (D) differs from what they think is expected to succeed in the role or what they are currently experiencing. They prefer to be more precise and their Self-Concept shows they feel they need to be more flexible. This may or may not be impacting their performance or their happiness in the role.
Seeing the differences is not enough to make assumptions or jump to any conclusions. The next step is always having a conversation with the employee. The data facilitates conversations around self-awareness, growth, stretching behaviors, or enhancing/improving an individual’s understanding of their role, their team, and what is expected of them at work.
Check the date!
It’s important to note when an employee’s most recent Self-Concept has been assessed, as it may change over time.
Was this page helpful? Spot a typo or inaccuracy? Let us know.
Factors
We all have drives, which create needs. Our behaviors are a response to a need. The PI Behavioral Assessment measures the amount and intensity of the four key behavioral drives to help predict and understand workplace behavior.
After several years of refining, Arnold Daniels created the Predictive Index Behavioral Assessment™ (BA). It was specifically designed to measure four motivating needs, or drives, that had the biggest effect on workplace behaviors: Dominance, Extraversion, Patience, and Formality.
If you know where a person falls for each factor, you possess a great deal of knowledge about what it would be like to work with them.

DOMINANCE: The drive to exert one’s influence on people or events.
EXTRAVERSION: The drive for social interaction with others.

PATIENCE: The drive for consistency and stability.

FORMALITY: The drive to conform to rules or structure.
Everyone has some amount of all four of these drives, which we call factors. Understanding the combination of the four factors and their intensity allows you to, very specifically, describe how a person prefers to communicate, make decisions, delegate, regard rules, and take action. This is your window into how a person prefers to behave.
Once you complete the Behavioral Assessment, you’ll see your Pattern and your Reference Profile.
- Pattern: Think of this as your specific location or address. Your pattern is unique to you and your assessment results.
- Reference Profile: Think of this as your general area or neighborhood. This gives you some basic details about a person without having to know the specific amount of dominance, extraversion, patience, or formality they have.
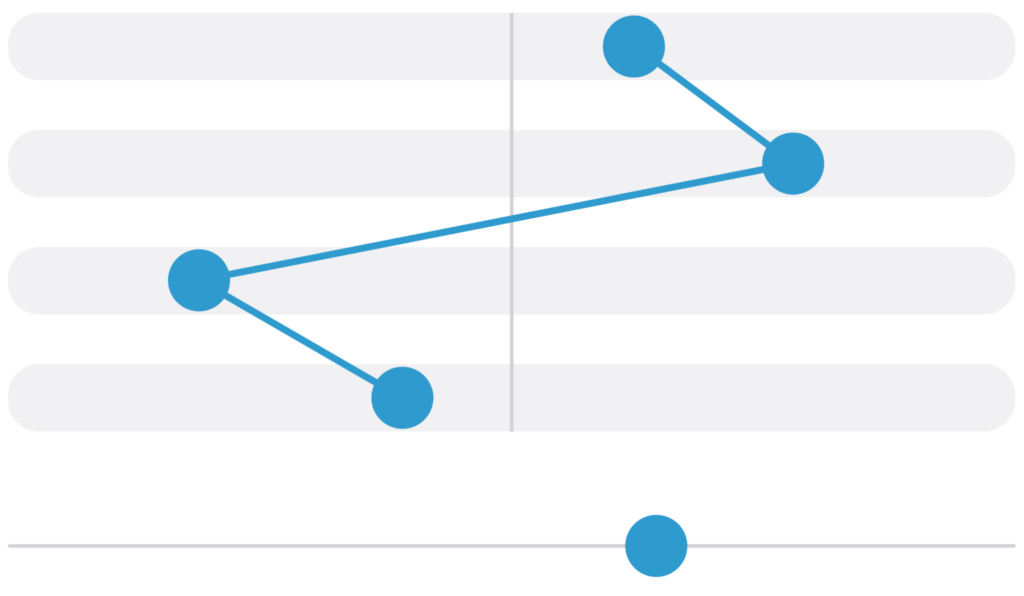
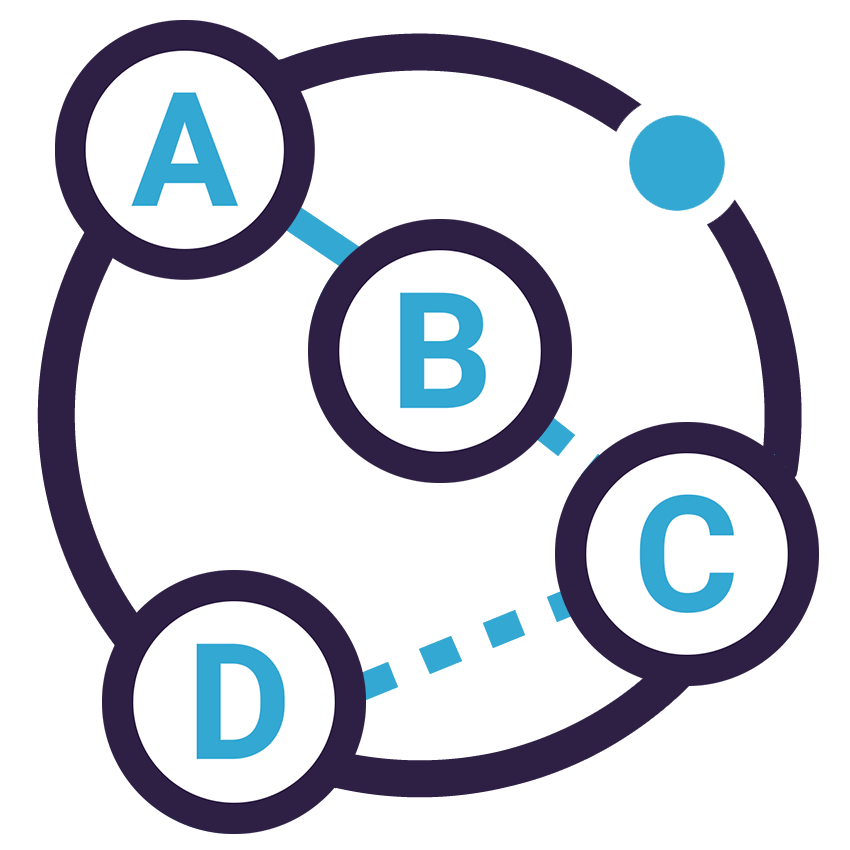
Factors on a pattern
When you look at your results, you’ll see a pattern like the example below. Factors appear as blue circles and they always appear, from top to bottom, A, B, C, D.
Factors that fall to the left of the midpoint represent a low amount of that particular drive, while those that land to the right of the midpoint represent a high amount.
Since there are no right or wrong responses to the Behavioral Assessment, low and high are neither good nor bad, they’re simply indicators to provide you with language and data to help you better understand a person.
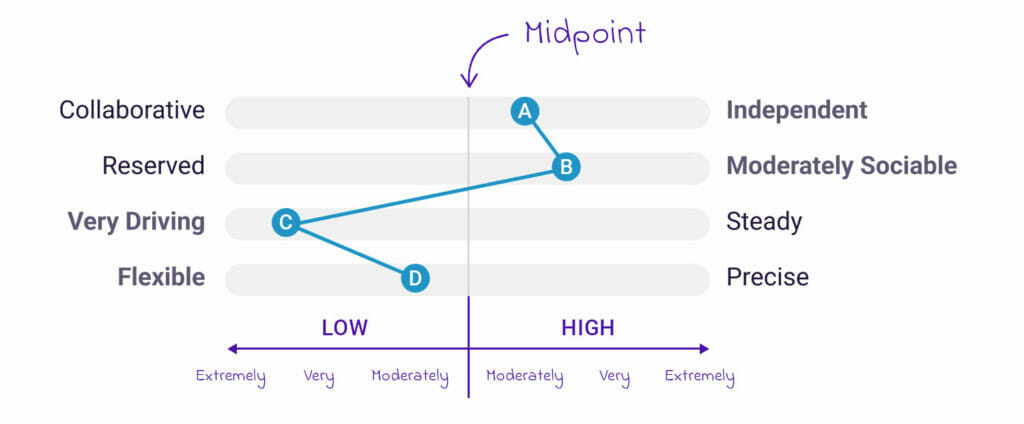
The further away from the midpoint a factor falls, the more forceful the expression of its associated behaviors will be. Because the way a drive is expressed changes depending on the level of that factor, the words we use to describe someone’s behavior change depending on how far their factor is from the midpoint. Let’s explore each one.
In the interactive below, choose which factor (A, B, C, or D) you’d like to learn more about from the left hand side. Then, drag the factor’s icon right or left on the slider to see how the words we use to describe behaviors become stronger or more forcefully expressed the further they are from the midpoint.
Now, drag each factor to the left (low) or right (high) to see descriptions for how these behaviors might show up in the workplace.
Factor E: Subjectivity and Objectivity
You’ll also see Factor E in some areas. This helps describe how what kinds of inputs someone is likely to rely on when making decisions.
How is E different from ABCD?
Factors A, B, C, and D measure the amount of a drive someone has, from extremely low to extremely high. Factor E is used as a secondary, modifying factor because it is not part of the theoretical behavioral model that underpins the primary factors. This means it’s possible to meet two people with the same Pattern who have different decision-making styles. For that reason, Factor E is visualized separately from A, B, C, and D.
Examples:
- If someone has a low C, they have a low amount of Patience. If they have a high C, they have a high amount of Patience.
- If someone has a high D, they prefer a lot of structure. If they have a low D, structure is not a priority.
E is different in that it’s not measuring how little or how much of a drive you have. Rather, it’s telling us if, when it comes time to make a decision, you’ll rely more heavily on subjective or objective information. We show this by putting the factor to the left or right of the midpoint:
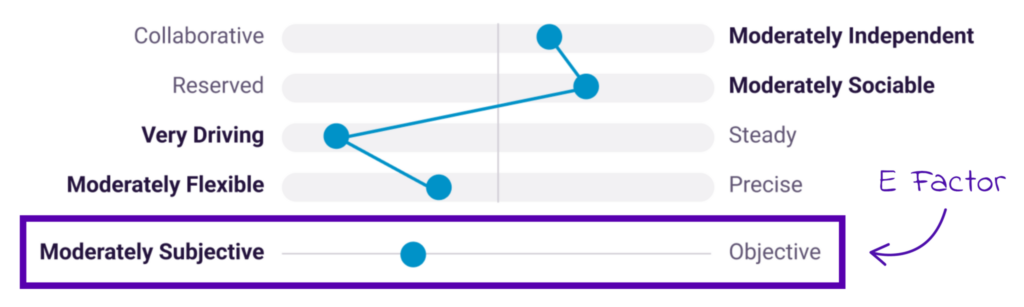
- If you see E on the left, it means a person will be more subjective in making decisions. Their ‘gut feeling’ is quite important, and they’re less likely to seek out all sides of the story prior to making decisions. They’ll rely more on what feels right, even if there aren’t numbers to back it up.
- If it’s on the right, they’ll be more objective. They’ll want to examine facts, check sources, and look to the data to guide their decisions.
Sigmas
There are times when you might see numbers and sigma symbols as part of a Behavioral Pattern. Sigmas appear on either side of the midpoint and show how far the person’s factor is from the overall norm sample average. Factor or “sigma” (𝜎) scores represent the standardized scores compared to other people around the world who selected the same number of adjectives.
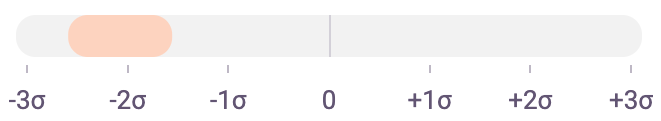
One sigma range essentially represents one standard deviation from the overall norm sample average. So, if you score farther left than -1.0𝜎 or farther right than 1.0𝜎, it means you are scoring higher than 68% of people for a given factor (conditional on the overall response rate). If you score farther left than -2.0𝜎 or farther right than 2.0𝜎, it means you are scoring higher than 95% of people. If you are in the rare group that scores farther left than -3.0𝜎 or farther right than 3.0𝜎, it means you are scoring higher than 99% of people!
Get even more insights with Factor Combinations
The four factors measure specific behavioral drives and give us a great amount of information on how a person prefers to behave. We can learn even more about why people behave the way they do by looking at how two behavioral drives interact. We call these Factor Combinations.
Was this page helpful? Spot a typo or inaccuracy? Let us know.
Factor Combinations
The four factors (A, B, C, and D) measure specific behavioral drives and help us start to understand why we behave the way we do. But, just knowing the factors without looking at how they work together is like learning single notes without learning full chords.
We can learn even more about why people behave the way they do by looking at how two behavioral drives interact. We call these interactions “factor combinations.”
Factor combinations refer to where one factor falls on the pattern in relation to another. It’s the interaction of two different behavioral needs.
Two things contribute to how strongly expressed factor combinations will appear:
- If the factor combination crosses the midpoint (one factor is high and one factor is low).
- If the distance between the two factors is wide. In fact, we advise you to look at the two factors that are the furthest from each other on a person’s pattern.
While we always start with which factors are the widest apart, all of the factor combinations in a pattern can give you further insight. Let’s look at an example for each factor combination.
The A and B factor combination provides insight into whether someone is more task or people oriented. It also gives you information about how people like to communicate, receive information, and interact with people.
- If someone’s A is higher than their B, they’re likely to be more task oriented. The high A means they’re independent and assertive and the low B means they’re analytical and introspective. They’re more direct and focused on completing tasks.
- If someone’s B is higher than their A, they’re likely to be more people oriented. The high B means they’re empathetic and sociable and the low A means they’re collaborative and harmony seeking. They focus on involving people and bringing them together.
The A and C factor combination shows how someone takes action. It helps us understand how quickly someone likes to jump into things and the amount of variety they like to experience.
- If someone’s A is higher than their C, they’re considered proactive. The high A is autonomous and venturesome while the low C is intense and fast-paced. Action is decided and taken quickly.
- If someone’s C is higher than their A, they’re considered responsive. The high C means they’re stable and comfortable with the familiar and the low A means they’re cooperative and accepting. Action is taken with thoughtful and careful consideration.
The A and D factor combination tells us how a person views risk. This helps you understand how much detailed information and how much encouragement a person may need, or how much freedom and opportunities to take risk they want.
- If someone’s A is higher than their D, they’re considered comfortable with risk. The high A means they’re venturesome and competitive while the low D means they’re spontaneous and flexible, so risk is viewed as an exciting challenge or opportunity.
- If someone’s D is higher than their A, they’re considered cautious with risk. The high D means they’re careful, cautious, and diligent, while the low A means they’re deferential and compliant, so risk can be worrisome and cause someone to be more conservative in their approach.
The B and C factor combination tells us if a person establishes a connection with others quickly or if those connections take time.
- If someone’s B is higher than their C, they’re likely quick to connect. The high B means they’re social and enthusiastic while the low C means they’re fast-paced, so connections and relationships are built quickly.
- If someone’s C is higher than their B, they’re likely to take time to connect. The high C means they’re calm and steady while the low b means they’re more reflective and introspective, so connections and relationships are built over time.
The B and D factor combination tells us about how someone interacts with others.
- If someone’s B is higher than their D, they’re informal. The high B means they’re social, expressive, and outgoing and the low D means they’re casual and spontaneous. They’re uninhibited in their friendliness and social interactions.
- If someone’s D is higher than their B, they’re more formal. The high D means they’re serious and reserved and the low B means they’re analytical and introspective. They’ll be more disciplined and cautious with new people.
The C and D factor combination provides insight into how someone views rules.
- If someone’s C is higher than their D, they’re casual with rules. The high C means they’re agreeable and easygoing and the low D means they’re informal and uninhibited, so rules are seen more as guidelines.
- If someone’s D is higher than their C, they’re careful with rules. The high D means they’re precise and thorough and the low C means they’re driving and intense, so they’re concerned with accuracy, punctuality, and adhering to the rules.
A=D Conflict – when Dominance (A) and Formality (D) collide
The Dominance (A) and Formality (D) relationship is all about risk. When the A and D factors are clearly high or low from each other, it’s easy to determine how someone views risk.
But, this factor combination has an extra special relationship, which we call the A=D conflict, which occurs when someone’s A and D are right on top of each other.
Think about the Dominance (A) factor as a gas pedal and the Formality (D) factor as the brake. When these factors are aligned with each other, it can cause situations where it takes longer for a person to come to a decision because they have their foot on the gas and the brake.
When this happens, the person might need more information, or maybe assistance with narrowing down the options, or also feeling that they have support even if they make an incorrect next step.
Now that you have some insight into Factors and Factor Combinations, there’s one last piece of information that will help you understand your Behavioral Assessment results: Reference Profiles.

Was this page helpful? Spot a typo or inaccuracy? Let us know.
Reference Profiles
Everyone who takes the PI Behavioral Assessment automatically falls under one of our 17 Reference Profiles, which provide a shortcut for understanding behaviors and needs that drive your people. They provide a general idea of a person without having to know the specific amount of Dominance (A), Extraversion (B), Patience (C), or Formality (D) they have.
It all begins with the four factors (the foundation of PI’s methodology) and behavioral insights.
Reference Profiles are created by taking someone’s factor scores and comparing to prototypical Reference Profile patterns. Factor scores are essentially used as coordinates to determine a profile. People fall under whichever prototypical Reference Profile is closest to their pattern.
When you ask someone where they live, they’ll likely tell you the name of an area or neighborhood you might be familiar with. For example, someone from New York City might name one of 5 neighborhoods – the Bronx, Brooklyn, Manhattan, Queens or Staten Island. When they invite you to their house, they’ll give you their exact address.
Reference Profiles are general neighborhoods and behavioral patterns are unique addresses.
You should always refer to a person’s unique behavioral pattern for insight for any process you’re incorporating PI into.
Some Reference Profiles have more variability in their patterns than others. Two people might be Collaborators but still have differences in their patterns. Some patterns might look alike but actually have different Reference Profiles. A person might technically be a Controller, but be close to an Analyzer as well. Or, they might look a lot like an Analyzer, but they’re technically a Controller.
Two patterns might look almost exactly alike but have different Reference Profiles. Not to worry! Remember, the general behavioral characteristics of each Reference Profile still apply to these people. But, this is why you should always take a person’s full pattern into account. Remember, Reference Profiles bring you to a person’s general neighborhood, not their exact house.
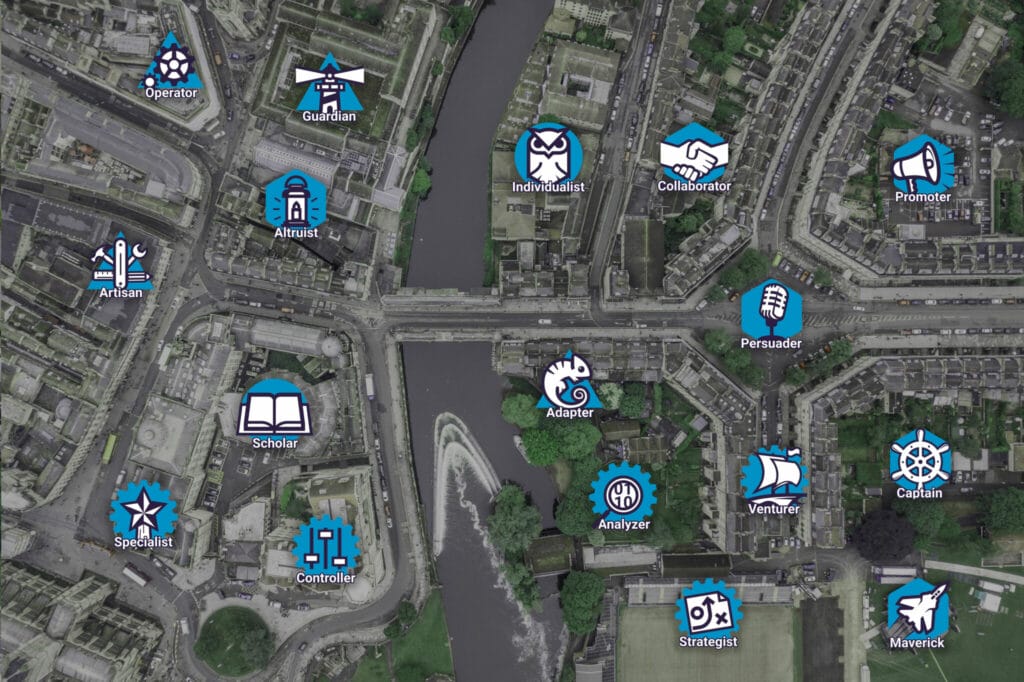
To create an even faster way to understand some basic information about Reference Profiles, they’ve been assigned 1 of 4 groups. They are Analytical, Social, Stabilizing, or Persistent. Each group is represented by a different shape. A gear for Analytical, hexagon for Social, triangle for Stabilizing, and circle for Persistent.

ANALYZER | CONTROLLER | SPECIALIST | STRATEGIST | VENTURER
The five Reference Profiles in the analytical group are more dominant than extraverted and have a low amount of patience. People in this group are generally more focused on tasks than people or relationships and tend to work at a fast pace.

ALTRUIST | CAPTAIN | COLLABORATOR | MAVERICK | PERSUADER | PROMOTER
The six Reference Profiles in the social group are all highly extraverted. People with profiles in this group are generally people-oriented and outgoing.

ADAPTER | ARTISAN | GUARDIAN | OPERATOR
The four Reference Profiles in the stabilizing group are less dominant and extraverted while having a high amount of patience and formality. People with profiles in this group are generally steady, detailed, and work well with structure.

INDIVIDUALIST | SCHOLAR
The two Reference Profiles in the persistent group are more dominant than extraverted with a high amount of patience. People with profiles in this group are generally task-oriented and deliberate.
Reference Profiles are descriptive, memorable, and helpful general categories for the 17 different types of behavioral configurations. They make it easy to quickly communicate some standard behavioral traits.
They’re also fun for you and your co-workers. Share your Reference Profile with pride!
The 17 Reference Profiles guide will help you fully understand a person’s needs, behaviors, signature work styles, strengths, common traps, and how to work well with each profile.
Our Manager’s Guide to Reference Profiles provides information on how to motivate and recognize, provide direction and feedback, delegate, and coach each Reference Profile.
A deeper look into each Reference Profile
Looking to find out more information on a specific Reference Profile? Check out one of the following video links to hear the Reference Profile explained by a PI Practitioner.
Translated Reference Profile guides
Was this page helpful? Spot a typo or inaccuracy? Let us know.
Introducing PI to your organization
Welcome to the Predictive Index (PI) community! You’re about to embark on a powerful journey. The decision to learn more about your employees and their needs and your belief that your people are your most valuable asset is what brought your organization to PI. We’re committed to helping you improve the working lives of your people through talent optimization — the practice of aligning people strategy with business strategy to achieve results.
We’re excited. You’re excited. Now it’s time to get your organization excited!
Step 1: Prepare
When you’re preparing to communicate about PI to employees at your organization, ask:
- Who is our audience?
- What do we want to communicate?
- Why have we invested in PI and what are our goals and objectives?
- When, ideally, would we like to have PI implemented?
- What questions might people have and are we prepared to answer them?
It’s often easier to roll out a new program if you incorporate it into existing processes. When evaluating this, consider:
- What level of participation we need to be successful?
- How PI will change how our employees currently operate?
- Which features and insights would be beneficial for employees to see?
- What is the timeline for making these resources available?
- How will we introduce new employees to PI so they can onboard quickly with their manager and team?
Now that you’ve taken stock of your ideal rollout plan, it’s time to help your employees feel comfortable with PI.
Step 2: Communicate
How you introduce PI to your current employees makes a huge difference. The more people in your organization who understand how PI works, its benefits, and how it will be used, the more comfortable they will be and the more they will participate. You’ll see the most value when everyone is speaking the same language. Getting people to realize that behavior and needs are at the center of what we do and that we should all be aware of each other’s needs is critical.
Successful adoption starts with communication to make sure everyone is aligned on and aware of expectations. We’ve found that hosting a Lunch & Learn to discuss PI with your organization can also help set the foundation and expectations for employees at all levels of your organization. You can use this presentation and/or show this video to educate them about the basics.
Step 3: Send the PI Behavioral Assessment
Successful adoption starts by assessing your employees. When employees understand themselves and their peers, they develop more productive working relationships and find the value of PI. Getting and sharing the data and insights helps everyone.
“Our people are our most valuable asset and we’re committed to providing a dynamic environment where everyone can be their best. As you heard at the [MEETING, DATE] or saw in the company email, the Predictive Index® Behavioral Assessment will help us be more aware of what drives and motivates ourselves and each other.
We’re eager to start using PI, so please complete the assessment by [DATE].
If you have any questions or would like to find out more about this exciting new initiative, please reach out to [INTERNAL CONTACT].”
Not quite ready to assess the entire organization? Take smaller steps to get started:
- Take the Behavioral Assessment yourself, and understand first hand what your employees will experience. Many clients assess their C-Suite first, so everyone can see how it works and align on how it will benefit their teams.
- Invite a single department to participate. Many clients have found the Sales team to be great pilot participants.
- Continue to share the value of PI with your organization and look for successes to share with the broader organization.
Step 4: Answer employee questions
People may have some anxiety over taking an “assessment.” They may think of it as a “test” or something they can fail. We want to make sure everyone knows there is no good or bad result to the BA. It’s a tool to help everyone understand what you need to succeed.
If an employee has questions about how the results will be used, let them know first and foremost that you plan on sharing the results with them directly. This will most likely take some of the fear out of taking the assessment.
The last thing you ever want to do is force someone to take an assessment. If you meet resistance and an employee doesn’t want to take the assessment, let it go for a little bit. The best thing you can do is educate them on the “whys” and let them see it in action first. Typically, once someone sees how beneficial this information is to an organization, they too will want in on the action. But let them get there on their own.
Employees may be unsure of how their results will be interpreted or used and may be nervous or uninterested in participation. Here are some questions you might encounter.
- What is this? The PI Behavioral Assessment is an untimed, free-choice, stimulus-response tool that measures an individual’s motivating drives and needs. It has been used by thousands of businesses around the globe for decades to assist in hiring, coaching, motivating, developing employees, and improving organizational culture.
- What if I do it incorrectly? There are no right or wrong answers – it’s not a test.
- Are there any rules? Just make sure you’re not distracted. Read instructions carefully and use your own judgment to answer questions. If you do not understand a particular word, just skip it.
- Is it timed? Time is not a factor; take as much time as you need.
Step 5: Get started in each product
Now that your current employees understand what PI is and how your organization plans to use it, it’s time to dive into each product you plan to use. It’s also important to make sure you understand how you’ll introduce PI to candidates (Hire) and new employees during onboarding (Inspire). The sooner they see it in the process, the sooner you’ll see results.
Each one incorporates self-awareness and awareness of others. Once we know what we need and what others need, we can make sure people are in the right roles, being managed in the way they need, solving conflict, improving team performance and the overall organizational culture.
That’s what we call talent optimization — the practice of aligning people strategy with business strategy to achieve results.
Was this page helpful? Spot a typo or inaccuracy? Let us know.
Our story
The Predictive Index was founded almost 70 years ago with an ambitious mission: Better Work, Better World.
Our passion, inherited from our founder Arnold Daniels, is to understand people and teams—specifically what drives behaviors at work. Like you, we strive to understand that behavior and ignite enthusiasm in your people.
Our software hones the wisdom, guidance, and data that help inspire employees to be the most productive, engaged, and self-aware professionals they can be.
Our founder
In 1942, Arnold Daniels volunteered for the U.S. Army Air Corps. Shipped off to England, the flight navigator and his team soon logged more than 30 missions—all without a single combat casualty.
That’s an extraordinary track record.
When commanders noted the team’s stellar performance, they sent a psychologist to work with Daniels to study what made the team so successful.
This was Daniels’ first introduction to psychometric testing—and what would become a lifelong passion: solving business problems by better understanding individuals.
In 1955, he released the first iteration of the PI Behavioral Assessment™. Since then, the Behavioral Assessment has been republished and validated multiple times to keep abreast with changes in modern psychometric practices and workforce applications.
PI today

Culture and values
We know that our chances of achieving our vision, Better Work, Better World, are only possible with our ability and drive to succeed. We take great pride in our culture, and at the heart of our culture are our core values.

Change@Work
Change@Work is a program any organization can use to help forge their own change. It’s built around three core tenets: inclusion, transparency, and employee-led action.

Hear from our customers
10,000+ companies trust The Predictive Index and are happy to share their experiences with PI and how they’re a part of our mission: better work, better world.

Careers at PI
PI is a place where people with diverse backgrounds, experiences, and perspectives collaborate on amazing, important work. If you’re looking to dig in and succeed, there’s a place for you here.
Was this page helpful? Spot a typo or inaccuracy? Let us know.
Our assessments
Our assessments have been validated through rigorous scientific testing and research over decades. They’re tried and true: We’ve assessed more than 25 million people around the world and major companies worldwide trust us to help:
- Avoid mishires, boost retention, and align hiring teams.
- Reduce turnover and continuously develop, motivate, and retain top employees.
- Build high-performing teams by aligning on goals and identifying how each individual contributes to the team’s success.
- Measure, track, and improve engagement with science-backed surveys, benchmarks, and recommended actions.
Over PI’s history, our researchers have conducted hundreds of criterion validity studies for clients, spanning many different industries, regions, and job roles. Our psychometricians routinely refine and test our tools to ensure they’re valid and reliable for everyday use in the workplace.
It all begins in development with careful content validation, field testing, form construction, and construct validation. Our researchers validate new use cases for assessments, monitor the instruments’ performance, and practice continuous improvements to ensure that the assessments continue to yield valuable, interpretable, actionable insights for clients.
Our psychometricians also conduct reliability studies to report the accuracy of scores (internal consistency), stability over time (test-retest reliability), and reliability of the psychological constructs that are measured. These studies help to quantify measurement error of the assessment to ensure scores will support their intended use cases. Reliability studies also help provide guidance to our clients on how to effectively use the results of PI assessments.
The PI Behavioral Assessment™
The PI Behavioral Assessment is an untimed, free-choice, stimulus-response tool that measures an employee’s natural behavioral drives and needs. It’s also far more than a personality test.
PI is your superpower: It lets you understand complex human behavior in six minutes or less—simply by answering two questions. Use the results to predict how individuals will behave in given situations, so you can make great hires, build winning teams, and more.
Employee behavior is a reflection of the unique ways you and your coworkers contribute to the team and organization. By understanding how these behaviors manifest day to day, you can take steps to accommodate your people’s needs, and improve your team as a whole.
The PI Behavioral Assessment, often referred to as “the BA,” measures four behavioral drives that provide a simple framework for understanding workplace behavioral styles. The drives collectively generate a pattern and a Reference Profile that show the extremes of each drive.
Continue learning about the Behavioral Assessment
The PI Cognitive Assessment™

The PI Cognitive Assessment measures general cognitive ability through three different categories of questions including numerical, verbal, and abstract reasoning.
The PI Cognitive Assessment was built and validated exclusively for use in the workplace and it provides insight into a person’s capacity to learn, adapt, and grasp new concepts. It does not measure IQ or previously acquired knowledge (e.g., job-specific knowledge), behaviors, or willingness to make an effort to learn new things. Rather, it indicates how fast an individual can be expected to acquire new knowledge.
The assessment consists of 50 multiple-choice questions from a larger question pool from three categories including verbal, numerical, and abstract reasoning. The questions are selected by the assessment’s linear-on-the-fly test (LOFT) engine to ensure equivalent content and difficulty for each administration, while also ensuring that a participant won’t be presented with the exact same assessment twice.
Candidates are tasked with completing as many as they can in 12 minutes. The resulting score, which is the total number of correct answers, indicates their ability to process complex information and their capacity to deal with the cognitive demands of a given position.
More than personality tests, they measure verbal reasoning, cognitive skills, and critical thinking. Armed with this data, along with more quantitative criteria, your business can improve its hiring process and make decisions that are based on objective criteria.
Our assessments provide objective cognitive and behavioral information that are true indicators of a candidate’s job performance, and therefore arm you with additional data points to help you make better informed hiring decisions.
Continue learning about the Cognitive Assessment
Was this page helpful? Spot a typo or inaccuracy? Let us know.