Analytics
Using the latest version of our software, PI2? Click here for the right support article.
The analytics tool allows you to directly compare a team’s drives and behaviors. This can be helpful to identify similarities and differences between individuals in a team.
All Factors Ensemble
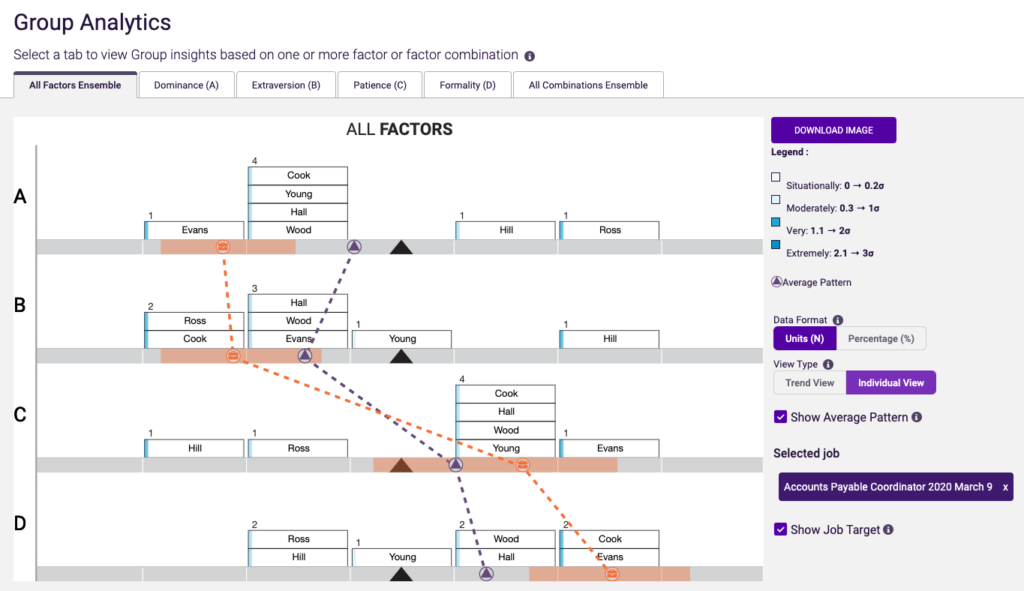
The All Factors Ensemble displays a graph of a group of individual’s behavioral drives. The name of each individual appears in the appropriate sigma range for each of their Primary Factors. Each populated sigma displays either the percentage of individuals in that sigma range, or the number of individuals in that sigma range, based on which measure you’ve chosen for the chart.
Individual Factors
The Individual Factors Graphs display where a group of people fall in relation for a specific factor to easily compare them at a glance. The name of each individual appears in the appropriate sigma range for their individual Factor. Each populated sigma displays either the percentage of individuals in that sigma range, or the number of individuals in that sigma range, based on which measure you’ve chosen for the chart.
The report will default to the date format in units and in trend view. You can change these to show in percentage and Individual view if needed. You can also enable or disable seeing the average pattern and the job pattern.
NOTE: If you access Analytics from a job page, list view, etc. you may notice the orange line all the way to the left of the graph. This means the job has not been added yet. If you want to compare the people to the job pattern you must go through the Inspire tab and add the job there.
All Combinations Ensemble
The All Combinations Ensemble will display the Factor Combinations for the team from left to right in order from most common Factor Combination to the least common among the team. Each populated sigma displays either the percentage or number of individuals corresponding to that Factor Combination based on the measure you’ve chosen to display in the chart.
Trend and Individual View
Each of the Analytics graphs (All Factors Ensemble, Individual Factors, and Factor Combinations) can be viewed in Individual or Trend View. Individual View will display the names of the individual’s included in each sigma range, while trend view will display columns for each sigma with no names displayed. This can be helpful if you want the selected individuals to remain anonymous.
Hover
In each of the graphs you can hover over name to highlight the location of each of their Factors or Factor Combinations. The color of the highlight indicates the strength of the Factor or Factor Combination. The legend at the top of the chart explains the meaning of each color.
To inform us of a typo or other error, click here. To request a new feature, click here.